LaTeX templates and examples — Charts
LaTeX can be used to produce a variety of different charts and diagrams, including: flowcharts, gantt charts, pie charts, branching and decision trees, family trees, histograms, bar charts and more. If you're looking for a particular type of chart that isn't featured here, please let us know, or submit your own example to the gallery.
Recent
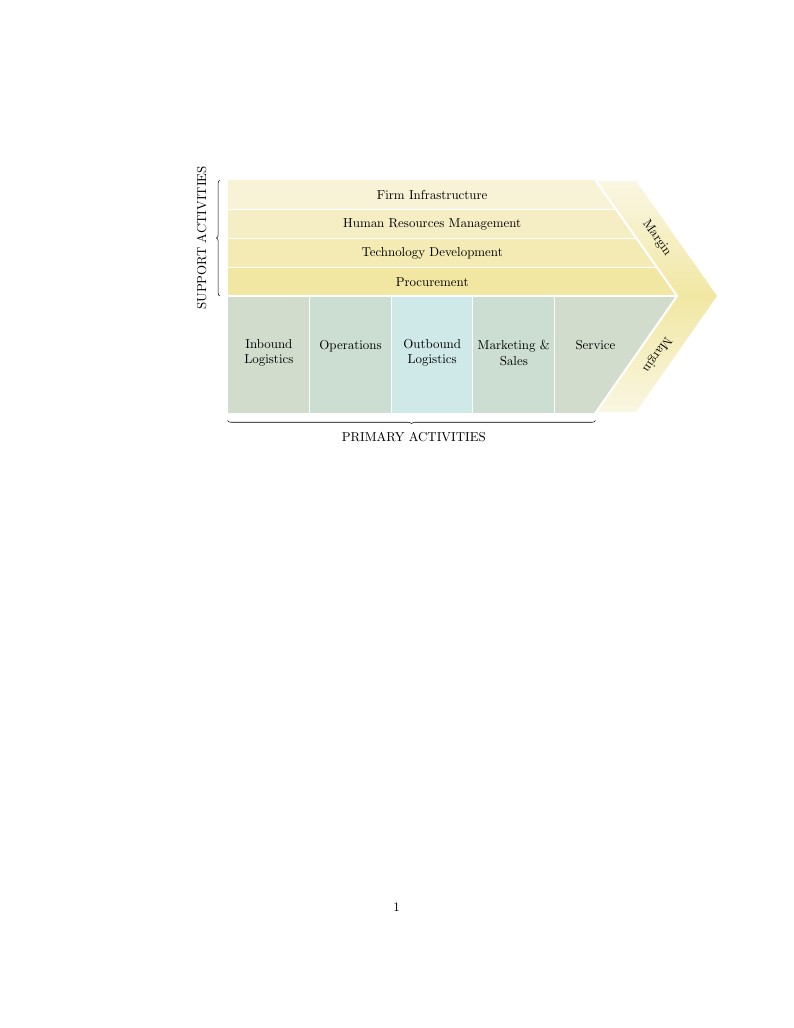
This popular visualization of the Porter Value Chain is a great example of how LaTeX can be used to produce striking, high quality formatting of simple objects such as tables. Originally posted as this answer on TeX StackExchange, we've pre-loaded the table into Overleaf to let you easily add your own content. Simply click the table to start editing online. Once you're done, you can insert the table into a longer LaTeX document, or download as a PDF for use as a standalone piece. If you're new to LaTeX, checkout the third part of our free online LaTeX course for more hints on creating presentations and drawings in LaTeX.
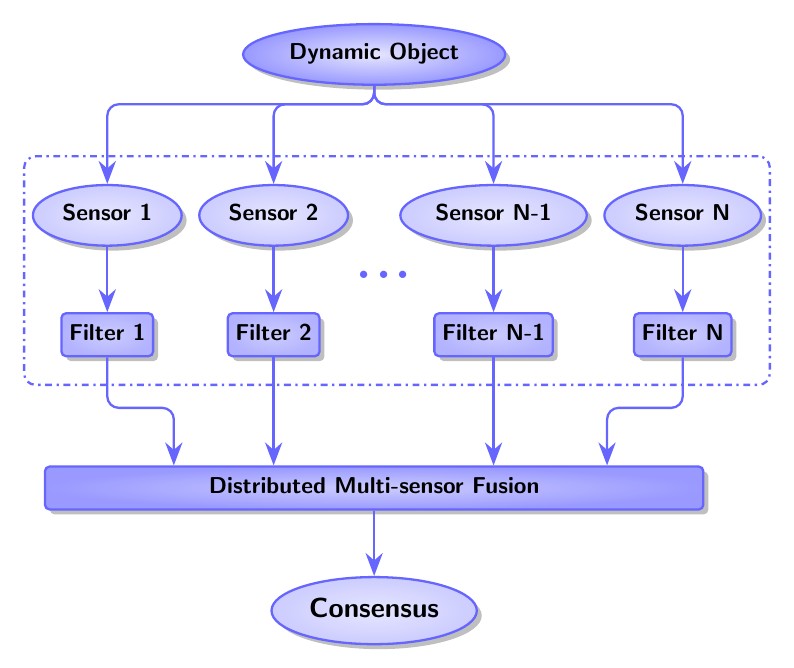
The output of this graph is used as Figure 1 of the paper: Wangyan Li, Zidong Wang, Guoliang Wei, Lifeng Ma, Jun Hu, and Derui Ding, “A Survey on Multisensor Fusion and Consensus Filtering for Sensor Networks,” Discrete Dynamics in Nature and Society, vol. 2015, Article ID 683701, 12 pages, 2015. doi:10.1155/2015/683701. It's based on http://www.texample.net/tikz/examples/hierarchical-diagram/. Relevant link: http://tex.stackexchange.com/questions/226461/how-to-draw-hierarchical-graph-like-this-one.
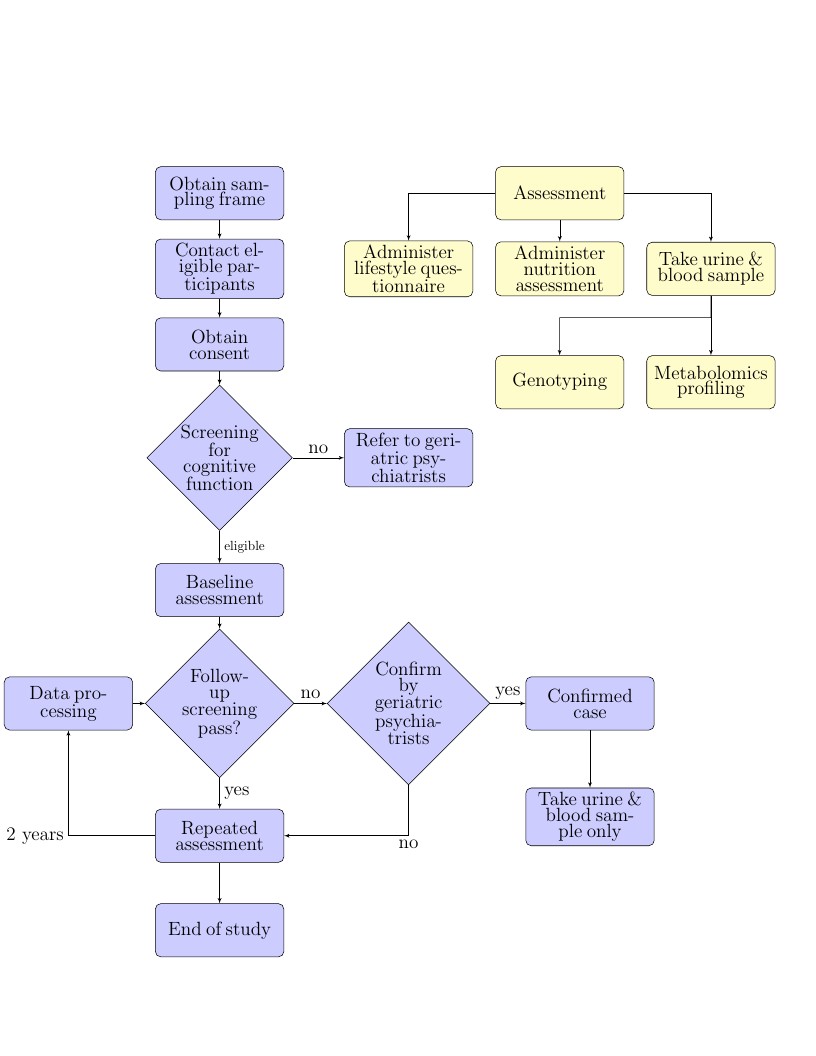
tikz flowchart of an epidemiology study
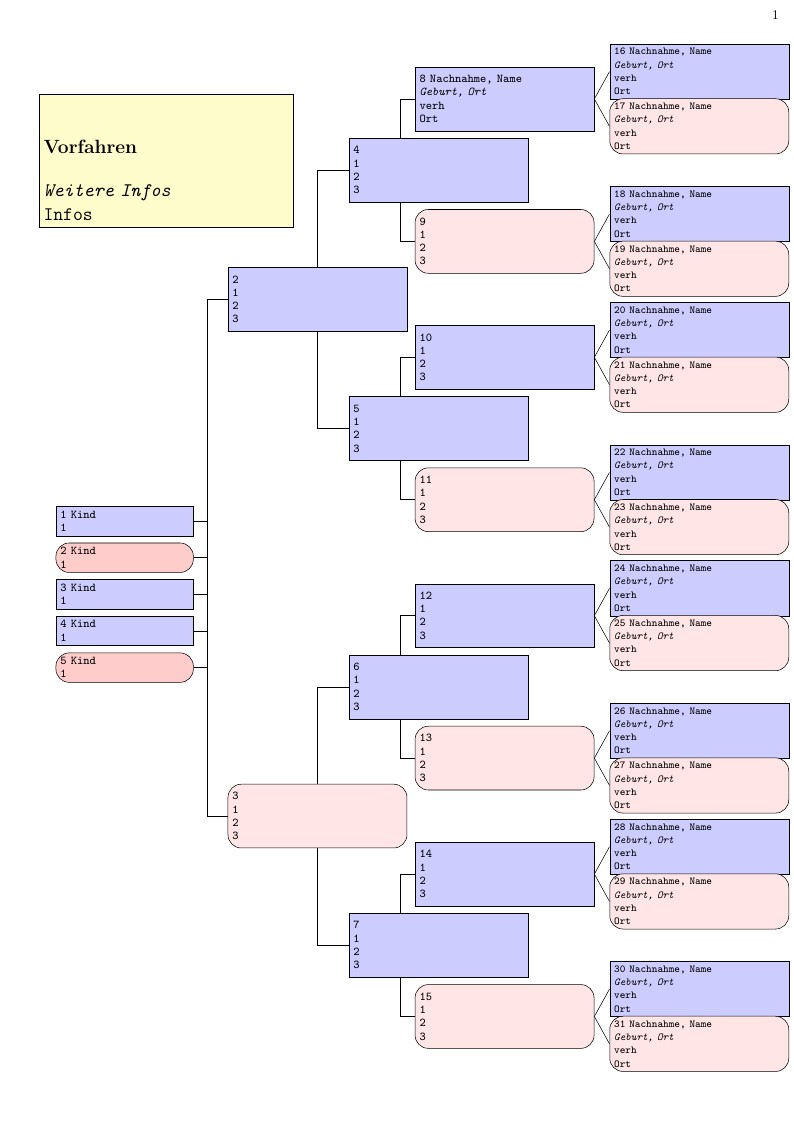
Family Tree table, Genealogy
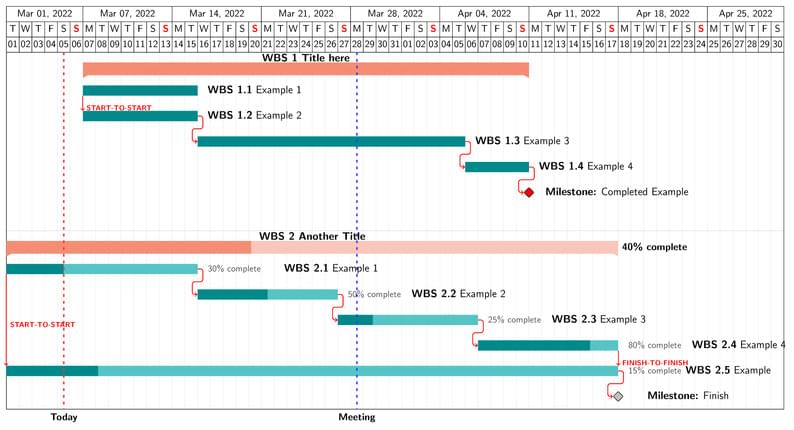
A Gantt chart template with already set up progress tracking and automatic calculation.
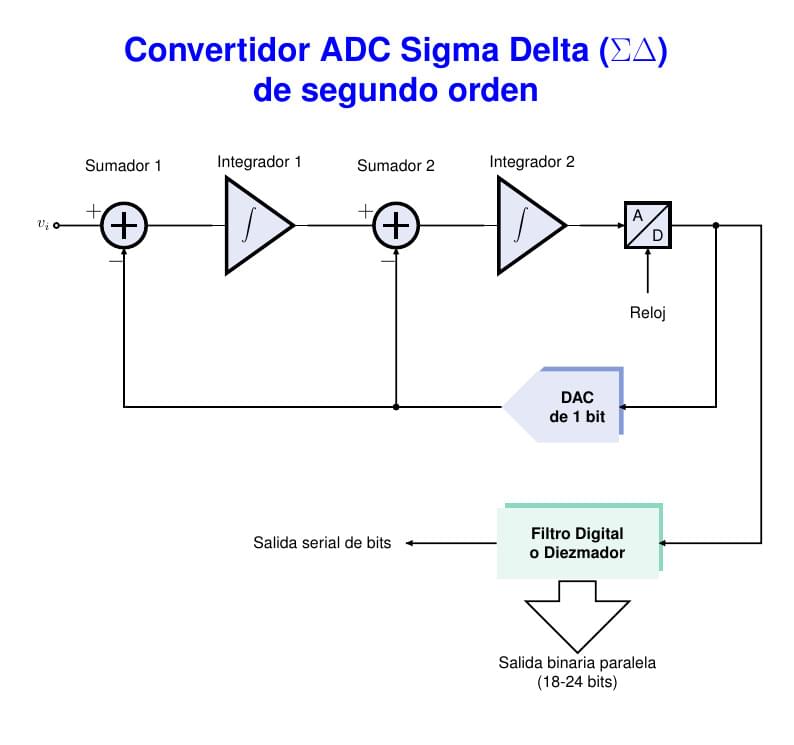
Este ejemplo muestra el Convertidor ADC (Analógico a Digital) Sigma Delte de Segundo Orden que a diferencia del Convertidor de primer orden, tiene dos etapas integradoras de las señales de diferencia que provienen de los sumadores. En este caso, a la salida del segundo integrador aparece el comparador como convertidor ADC de 1 bit cuya salida alimenta al bloque convertidor DAC (Digital a Analógico) de 1 bit y a la etapa de Filtro Digital o Diezmador. La teoría, en idioma inglés, de este diseño se encuentra en el documento "How delta-sigma ADCs work, Part 1", publicado por la empresa Texas Instruments de Bonnie Baker, disponible en el enlace https://www.ti.com/lit/pdf/slyt423?keyMatch=BONNIE%20BAKER&tisearch=Search-EN-technicaldocument
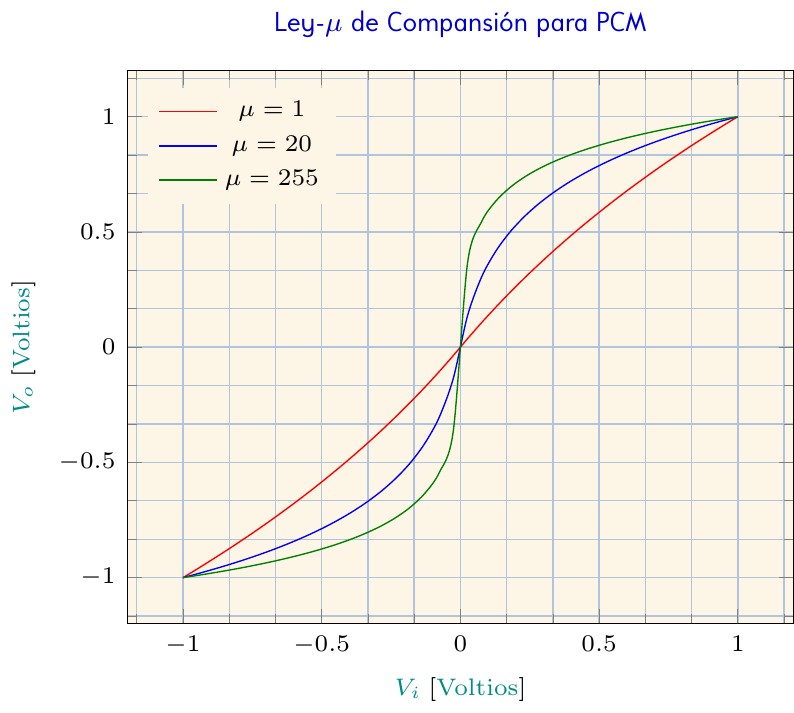
Este gráfico presenta las características de compresión de una señal telefónica de entrada cuando es comprimida de manera analógica o digital usando la Ley-Mu tal como es descrita en la Recomendación G.711 de la Unión Internacional de Telecomunicaciones. Esta Ley es descrita por la siguiente ecuación: f(x, \mu)=sign(x)*\frac{\ln(1+\mu\left |{x}\right |)}{\ln(1+\mu)} en la que sign(x) es la "función signo". La gráfica muestra los resultados para 3 valores de \mu distintos.
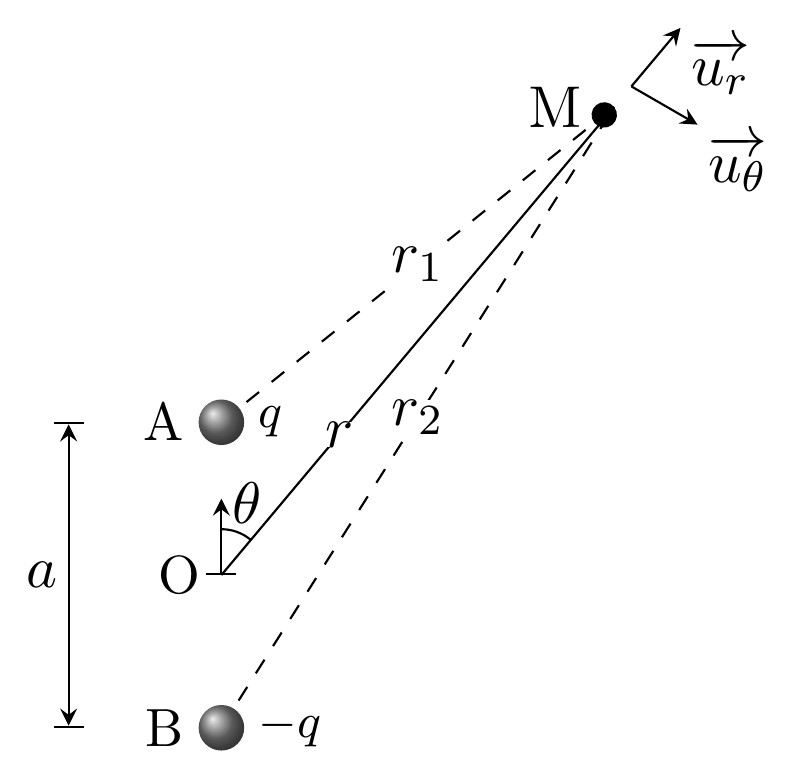
Ce document regroupe les codes TIKZ des figures utilisées pour le cours "Interaction électrostatique" situé à la page http://femto-physique.fr/electromagnetisme/interaction_electrostatique.php
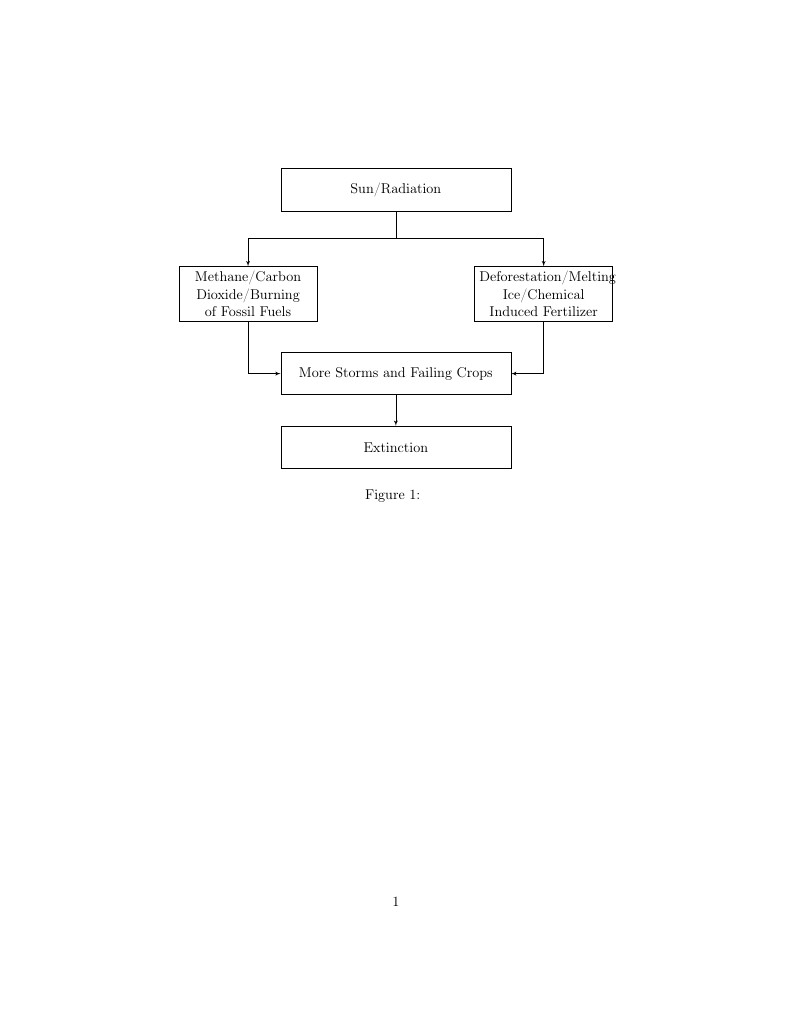
What is global warming doing to us?
\begin
Discover why over 25 million people worldwide trust Overleaf with their work.